
前言
本文是GC系列文章的首篇,主要为下一篇《第三视角: 一个ART GC优化的故事》文章做铺垫。
本文将根据下面的大纲,简单的介绍下GC相关的基础知识,GC这块的内容较多,也相对较为复杂。如果想要研究清楚细节,需要花费较多的时间,也需要有读者有足够的耐心和相关知识背景。
本文深受ART虚拟机 | GC的触发时机和条件一文的启发
文中涉及代码均摘自Android S。
大纲
- 研究ART GC目的
- ART GC诞生背景
- 里程碑(引入CC)
- ART GC重要特性
- ART GC类别划分
- Multiplier的引入
- 堆可分配字节数的计算
- GC触发阈值的计算
- 从Systrace角度看GC
- 参数修改策略
- 写在最后
- 参考文献
研究ART GC目的
尽管GC经过多年发展已得到显著改进,但是在实际项目中仍然会遇到很多GC引起的性能问题。
特别是小内存项目上(低于6G)尤为明显,遇到的大部分问题来自于应用不规范的行为,小部分是由于GC机制在特定场景下导致的性能问题。
GC性能问题主要分为两类:
- 对于应用而言,如果代码中存在频繁分配对象、存在内存泄漏、存在主动调用GC接口等问题都有可能导致GC性能问题。
主要体现在GC运行的线程HeapTaskDaemon占据CPU资源较多或争抢大核,可能会引起绘制得不到及时调度,导致掉帧的情况。 - 另外对于GC机制本身而言,虽然Google一直在优化,但是现在仍然存在一些场景下的表现无法令我们足够满意。
比如高负载时争抢CPU资源,小内存进程在某些场景下的频繁触发,多进程应用启动时由于GC导致的卡顿黑屏等现象。
GC诞生背景
当我们在学习新技术的时候,了解其诞生背景及其演进变化的历程,再结合具体的代码细节,将有助于我们对这个技术形成一个连续的认知。
举个网络拥塞控制的例子,网上关于拥塞控制算法的文章铺天盖地,几乎都在讨论其中的代码细节。
但是其诞生的历史背景及其本质是为了解决什么问题,却很少有文章能真正解释清楚。
为什么说历史背景至关重要
还是以拥塞控制为例,如果你不了解1986年的网络大崩溃事件发生的原因,也就无法理解1988年Jacobson提出的TCP拥塞控制的论文。
进而即便你多么熟悉TCP的代码细节,你也无法理解这一切实现背后的真正的逻辑,甚至会草率错误的认为拥塞控制是为了加快发包的速度,以至于后面关于这方面的工作很可能是扯淡。
再回到本文的主题GC,聊下GC诞生的背景
1960 年前后诞生于 MIT 的 Lisp 语言是第一种高度依赖于动态内存分配技术的语言,Lisp 语言先天就具有的动态内存管理特性要求 Lisp 语言的设计者必须解决堆中每一个内存块的自动释放问题(否则, Lisp 程序员就必然被程序中不计其数的 free 或 delete 语句淹没),这直接导致了垃圾收集技术的诞生和发展。
J. McCarthy 作为 Lisp 之父,他在发明 Lisp 语言的同时也第一次完整地描述了垃圾收集的算法和实现方式。
有兴趣的话可以网上搜索这篇文章, 讲的比较详细 <GC技术简单而有趣的发展史>
里程碑(引入CC)
史前时代Dalvik->ART的诞生(Android 4.4)->发展的ART(Android 5.0 ~ 7.0)
->重大变革的ART(Android 8.0 引入Concurrent Copying)->Android 10开始再次引入分代.
8.0版本上引入的Concurrent Copying是一项重大改革,大幅提升了Android手机的整机性能表现。
8.0版本的GC相比之前的版本改进和提升如下:
- GC always compacts the heap: 32% smaller heap sizes on average compared to Android 7.0.
- Compaction enables thread local bump pointer object allocation: Allocations are 70% faster than in Android 7.0.
- Offers 85% smaller pause times for the H2 benchmark compared to the Android 7.0 GC.
- Pause times no longer scale with heap size; apps should be able to use large heaps without worrying about jank.
- GC implementation detail - Read barriers:
- Read barriers are a small amount of work done for each object field read.
- These are optimized in the compiler, but might slow down some use cases.
重要特性
下面简单介绍CC上几种主要的特性,如果阅读过程中有些名词不明其意,大可不必感到困惑。
知道其大概的角色作用即可,后面的GC系列文章会对每个特性展开来详细梳理。
RegionTLAB
1 | CC enables use of a bump-pointer allocator called RegionTLAB. |
这里提到的TLAB 即 thread-local allocation buffer,AllocObjectWithAllocator中会先检测如果当前线程TLAB区域的剩余空间可以容纳下这次分配的对象,则在TLAB区域中直接分配。
分配算法采用Bump Pointer的方式,仅仅更新已分配区域的游标,简单高效。
art/runtime/gc/heap-inl.h1
2
3
4
5
6
7
8
9
10
11
12
13// If we have a thread local allocation we don't need to update bytes allocated.
if (IsTLABAllocator(allocator) && byte_count <= self->TlabSize()) {
obj = self->AllocTlab(byte_count);
DCHECK(obj != nullptr) << "AllocTlab can't fail";
obj->SetClass(klass);
if (kUseBakerReadBarrier) {
obj->AssertReadBarrierState();
}
bytes_allocated = byte_count;
usable_size = bytes_allocated;
no_suspend_pre_fence_visitor(obj, usable_size);
QuasiAtomic::ThreadFenceForConstructor();
}
值得注意的一点是,TLAB在创建之初,它的大小已经计入了num_bytes_allocated_,所以这次虽然分配了新的对象,但num_bytes_allocated_没必要增加,这实际上是一种空间换时间的策略,代价就是会导致num_bytes_allocated_略大于真实使用的字节数。
谷歌对此修改的commit message:1
2
3
4
5
6
7New TLAB allocator doesn't increment bytes allocated
until we allocate a new TLAB. This increases allocation
performance by avoiding a CAS.
MemAllocTest:
Before GSS TLAB: 3400ms.
After GSS TLAB: 2750ms.
Read barrier
1 | CC performs heap defragmentation by concurrently copying |
CC可以通过在不暂停应用线程的情况下并发复制对象来执行堆碎片整理。这是在read-barrier的帮助下实现的,read-barrier会拦截来自堆的引用读取,无需开发者进行任何干预。
注意对第一句话的理解,应用GC的时候不会暂停应用,也就是说这个时候可能存在分配对象的行为,说的其实正是并发。
后面的实际案例在计算自上次GC后新分配大小时会用到这一点,目前的GC都是支持read-barrier的,read-barrier的诞生是为了更大程度的降低GC暂停时间。
一次暂停
1 | GC only has one small pause, which is constant in time |
对Dalvik有所了解的话,都知道Dalvik在mark阶段需要暂停应用线程两次,sweep阶段需要暂停一次,三次的STW开销会带来明显的卡顿。
到了ART时代,启动 GC 后不再是两次暂停,而是一次暂停,因为(packard pre-cleaning)的存在,在暂停前就做了许多事情,减轻了暂停时的工作量。
支持分代
1 | CC extends to be a generational GC in Android 10 and higher. |
谷歌对分代的支持历经开,关,开,具体的缘由没有细跟,不过最新Android版本支持分代,分代的好处谷歌解释为更加轻松回收存留期较短的对象,有助于提升GC的吞吐量,并且降低full GC的时机。
注意这里提到了一个GC吞吐量的概念,笔者之前从事过网络工作,所以自然而然的想到了WIFI的吞吐量,WIFI吞吐量可以简单的理解为单位时间内通过某个信道的数据量。
那么这里的GC 吞吐量指的又是什么呢? 可以理解为单位时间内释放的字节数
GC类别的划分
对GC的分类有不同的指标,可以从是否并发,回收力度等指标分类。
回收力度划分
art/runtime/gc/collector/gc_type.h1
art/runtime/gc/collector/gc_type.h// The type of collection to be performed. //The ordering of the enum matters, it is used to determine which GCs are run first.enum GcType {// Placeholder for when no GC has been performed.kGcTypeNone,// Sticky mark bits GC that attempts to only free objects allocated since the last GC.kGcTypeSticky,// Partial GC that marks the application heap but not the Zygote.kGcTypePartial,// Full GC that marks and frees in both the application and Zygote heap.kGcTypeFull,// Number of different GC types.kGcTypeMax,};
如下摘自谷歌的一笔commit message:1
2
3
4
5
6
7
8The new behaviour has that we do sticky GC until we have
less space remaining than minimum free after the GC.
When this occurs, we set the next GC to be a partial GC.
After a partial / full GC we grow the heap and set the
next GC to be a sticky GC. This prevents the heap from
always growing more than the target utilization,
while ensuring that we do sticky GC often.
建议随着后面不断的深入学习再回过来读这段话,相信会理解的更深。
大概意思是我们会尽可能的使用sticky的回收方式,这种回收只会回收自上次GC以来新分配的对象,是一种轻量回收方式,但是回收力度有限。
当剩余的可用空间低于设定的最小值即min_free,此时将下次GC类别设定为partial GC,加大回收的力度,但是当我们使用partial GC或者full GC后,应该将下次GC类型设定为sticky,从而避免堆的使用率经常超过目标值(默认0.75),所以需要经常进行sticky方式的回收。
对应用影响程度划分
如果基于GC对应用状态的影响分类的话,大致可以分为并发类和阻塞类。
并发类GC:GC在GC回收线程(HeapTaskDaemon)执行,阻塞类GC在进程的工作线程执行。
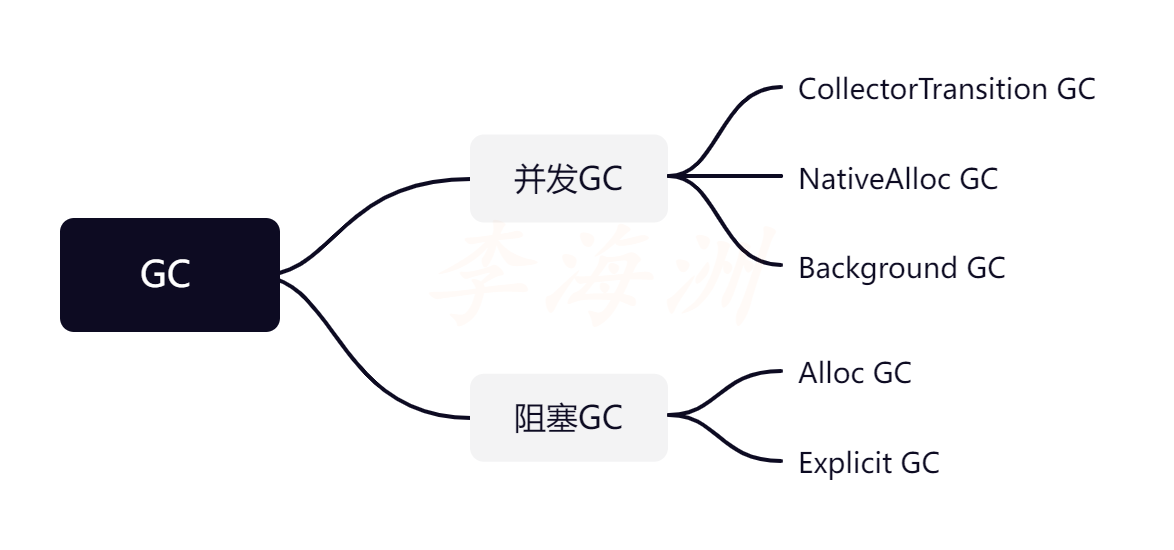
需要注意这里的GcCauseBackground,这里的“Background”并不是指应用切到后台才会执行GC,而是GC在运行时基本不会影响其他线程的执行,即并发GC。
有了上面的知识铺垫,下面将进入本文最重要的部分,将依次介绍Multiplier的引入,target_size计算过程,concurrent_start_bytes_计算过程这三部分。
这三部分相互关联,为了能够更直观的理解这三部分的关系,本地画了一个整体的概览图(花了大半小时画完…….),后面的内容主要也是围绕下面这个图进行讲解。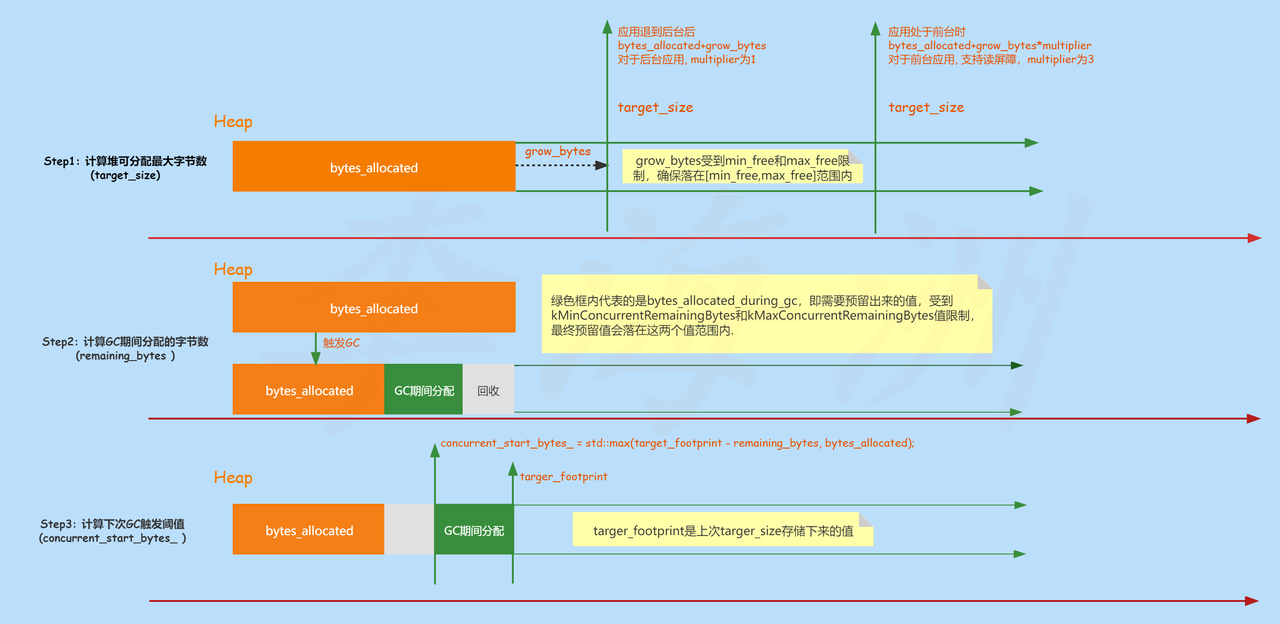
现在看不懂没有关系,在阅读完后面的内容之后,再回过头来看这个图,相信会理解的更加深刻。
Multiplier的引入
我们在后面计算预留内存的时候,不论是否是sticky回收,都会使用到Multiplier。
这个值主要是为了前台应用设定的,引入该值目的是为了提升前台应用的性能,代价是堆的利用率下降,关于对性能的影响,下面会进行说明。
先看下对于Multiplier的值来源1
2
3
4
5
6
7
8
9
10
11
12
13art/runtime/runtime.cc
//Extra added to the default heap growth multiplier.
//Used to adjust the GC ergonomics for the read barrier config.
static constexpr double kExtraDefaultHeapGrowthMultiplier = kUseReadBarrier ? 1.0 : 0.0;
float foreground_heap_growth_multiplier;
if (is_low_memory_mode_ && !runtime_options.Exists(Opt::ForegroundHeapGrowthMultiplier)) {
// If low memory mode, use 1.0 as the multiplier by default.
foreground_heap_growth_multiplier = 1.0f;
} else {
foreground_heap_growth_multiplier =
runtime_options.GetOrDefault(Opt::ForegroundHeapGrowthMultiplier) +
kExtraDefaultHeapGrowthMultiplier;
}
后台时Multiplier为1,我们主要看下前台的值,最新Android版本上都是支持ReadBarrier的,那么kExtraDefaultHeapGrowthMultiplier值也就是1。
再看下ForegroundHeapGrowthMultiplier的值来源于如下:
1 | static constexpr double kDefaultHeapGrowthMultiplier = 2.0; |
所以对于前台应用,Multiplier默认的值是2+1=3。
下面讲的堆大小的调整,下次GC触发阈值计算都是在GrowForUtilization中发生的,而GrowForUtilization又是在CollectGarbageInternal触发的,所以有必要先介绍下CollectGarbageInternal主要做的事情:
- 调用RequestTrim做实际的堆裁剪,将空闲内存归还给系统,这块的内容细节较多,后面会另起一篇文章进行详细的介绍;
- 第二步会执行SelfDeletingTask* clear = reference_processor_->CollectClearedReferences(self);
- 第三步也是我们本文重点介绍的一步,这一步将进行堆大小的调整以及计算下次触发GC的阈值
那么什么时候会触发CollectGarbageInternal进行垃圾回收呢?
在ART分配对象失败或者已使用内存超过某个设定的阈值就会触发
堆最大可分配字节数的计算
堆最大可分配字节数指的是代码中的target_size,一个仅具有指导意义的最大可分配字节数,为何说仅有指导意义,后面会解释。
在此之前,我们先了解下Sticky GC是什么?
谷歌对此的定义如下:1
2Sticky mark bits GC that attempts to only free objects
allocated since the last GC.
Sticky GC只会回收自上次GC以来新分配的对象,是分代GC下的一种GC类型,也可以理解为Young-generation GC,那么非kGcTypeSticky指的是哪些GC类别呢?对应Partial GC以及Full GC。
那么什么时候会使用Sticky GC,什么时候会触发Partial GC以及Full GC呢?后面GC系列文章会进行讲解,总体而言,执行Sticky GC频率最高,最低是Full GC。
下面会看下kGcTypeSticky以及非kGcTypeSticky类别GC的target_size计算过程。
非kGcTypeSticky GC
1 | if (gc_type != collector::kGcTypeSticky) { |
注意这行代码bytes_allocated * (1.0 / GetTargetHeapUtilization() - 1.0);
这里有一个容易陷入的误区,如果单纯的看头文件中的定义注释
1 | //Target ideal heap utilization ratio, implements //dalvik.system.VMRuntime.getTargetHeapUtilization.double GetTargetHeapUtilization() |
可能会认为这个值返回的是默认的最优值0.75,其实这个值是一个动态变化的值,当一次GC发生后,堆的大小会resize。
此时GetTargetHeapUtilization的值等于存活对象大小除以堆的大小,算出的delta是除去已分配的字节数后空闲的大小。
算出delta后,我们接着往下看,可以看到grow_bytes并不单纯由delta决定,还会受到max_free_以及min_free_的影响,最终确保grow_bytes 的值不会超出这两个值范围。
这里的max_free_本意是target_size与已分配内存间可允许的最大差异,差异过小会导致GC频繁,差异过大会延迟下一次GC的到来,目前很多设备将这个值设为8M,min_free_为512K。其实针对RAM超过6G的大内存设备,Google建议可以提高min_free_,用空间换时间获取更好的GC性能。
有了grow_bytes 之后,再根据如下代码1
bytes_allocated + static_cast<uint64_t>(grow_bytes * multiplier);
计算出目标堆大小。
大致的过程可以用下图表示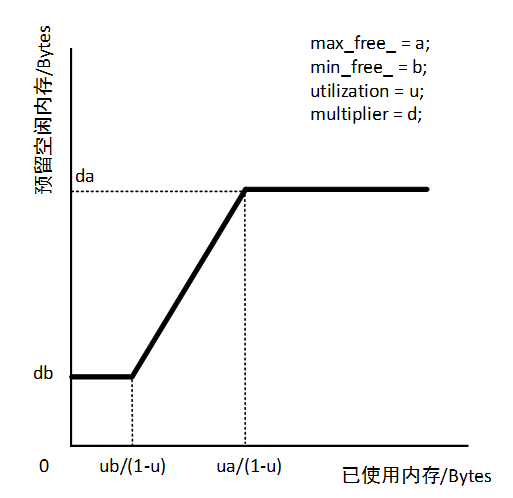
kGcTypeSticky GC
1 | // If we have freed enough memory, shrink the heap back down. |
对于本次是非kGcTypeSticky回收的方式,设定下次GC类型稍微复杂一些,会涉及到吞吐量之类的指标,后面的GC系列文章中会细谈,这里只关注target_size的计算过程。
- 如果bytes_allocated + adjusted_max_free < target_footprint说明此次的GC回收效果明显,注意这里grow_bytes 的值被赋予了max_free_,表示倾向于预留max_free_的空间大小,所以对于这个判断条件中的情况,其grow_bytes 会是一个恒定的值即max_free_。
- 否则的话即else中的情况,target_size的值是对bytes_allocated和target_footprint两者取最大,到这里你可能会疑惑bytes_allocated较大的情况,其实是有这个可能的,因为并发的缘故,可能存在GC期间分配大小大于回收数值的情况。
那么此时target_size设定为bytes_allocated,下次分配对象时,bytes_allocated 立马就超出了target_size,会不会导致分配失败的情况?
其实不会,唯一限制堆内存分配的只有growth_limit_,这也解释了为何我们前面说target_size只有指导意义,但是这种情况确实会立即触发一次GC。
下面是谷歌的一段commit message对OOM的解释1
2
3
4
5Are we out of memory, and thus should force a GC or fail?
For concurrent collectors,out of memory is defined by growth_limit_
For nonconcurrent collectors it is defined by target_footprint_
unless grow is set.If grow is set, the limit is growth_limit_
and we adjust target_footprint_to accomodate the allocation.
这个时候,你可能还有疑问,为啥不将此时的target_size适当的增大,其实是因为此时的GC是Sticky,只回收自上次GC以来新分配的对象,回收力度是比较小的。
如果它释放的空间不多,接下来还可以用Full GC来更彻底地回收。
换言之,只有等Full GC回收完,才决定将GC的水位提升,因为这时已经尝试了所有回收策略。
再回到上面提到的问题,multiplier的引入为何能够提升前台应用的性能?
关于target_size 的计算过程中,不论是否是kGcTypeSticky方式,都涉及到了multiplier因子,multiplier的引入直接改变了前台应用的target_size值,此时你可能会疑惑这样的话堆使用率不就下降了吗? 其实这是一种空间换时间的做法
如果堆大小扩展的不多,那么对于前台应用很快就会用完,下次GC便会早早的到来,虽说现在只有一次暂停,但是仍然可能会带来性能问题。
引入multiplier之后,前台应用有了足够的堆空间,会延迟下次GC到来的时间,也可以理解为降低GC的频率。
画了一个堆大小调整图,针对delta处于min_free和max_free之间的情况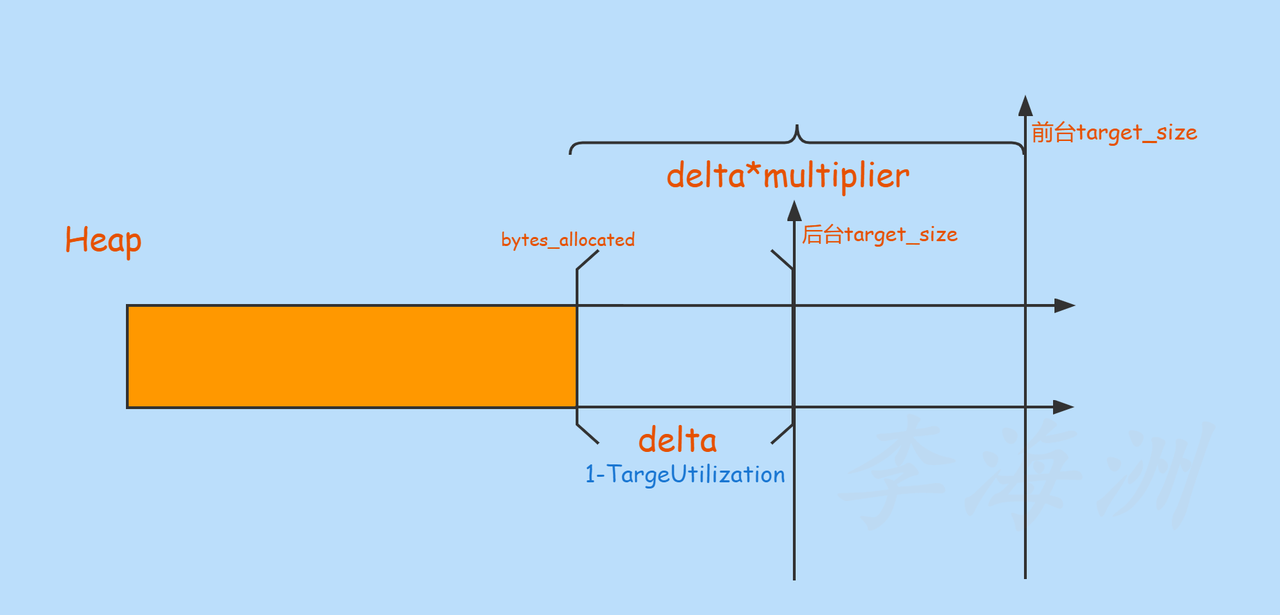
堆空间调整过程明白了,那么下次GC触发阈值是如何计算出来的呢?
GC触发阈值的计算
下面我们将继续往下看,下次GC触发阈值在代码中指的是concurrent_start_bytes_。
当我们在Java中通过new分配对象时,VM会调用AllocObjectWithAllocator来执行真实的分配。
在每一次成功分配Java对象后,都会去检测是否需要进行下一次GC,这就是GcCauseBackground GC的触发时机。
1 | AllocObjectWithAllocator->CheckConcurrentGCForJava->ShouldConcurrentGCForJava |
关键代码1
2
3
4
5
6
7inline bool Heap::ShouldConcurrentGCForJava(
size_t new_num_bytes_allocated) {
// For a Java allocation, we only check whether the number // of Java allocated bytes excceeds a threshold.
// By not considering native allocation here, we (a) ensure that Java heap bounds are
// maintained, and (b) reduce the cost of the check here.
return new_num_bytes_allocated >= concurrent_start_bytes_;
}
触发的条件需要满足一个判断,就是最后一行代码new_num_bytes_allocated(所有已分配的字节数,包括此次新分配的对象) >= concurrent_start_bytes_(下一次GC触发的阈值),就请求一次新的GC。
new_num_bytes_alloated是当前分配时计算的,concurrent_start_bytes_是上次GC结束时计算的。
更新target_footprint_ 值
1 | if (!ignore_target_footprint_) { |
存储target_size的值,并通过target_size更新target_footprint_ 的值
concurrent_start_bytes_
1 | // Minimum amount of remaining bytes before a concurrent GC is triggered. |
整个处理过程大致流程如下:
- num_bytes_alive_after_gc_此次GC结束后已分配的字节数,不包括GC期间新分配的字节数
- bytes_allocated_during_gcGC
期间分配的字节数,计算很简单,通过bytes_allocated_before_gc减去freed_bytes就 是新增的,因为由于并发的缘故,分配和回收很可能是同步进行的,这个思想将贯穿整个GC机制。 - remaining_bytes这个值指的是gc期间新分配对象的大小。
同样的,对于预留值也有范围限制,限制在128 KB到512 KB范围之间之间。
最后再来看这个计算公式concurrent_start_bytes_ =std::max(target_footprint - remaining_bytes, bytes_allocated);
之所以需要用target_footprint减去remaining_bytes,是因为在理论意义上,target_footprint_代表当前堆的最大可分配字节数。而由于是同步GC,回收的过程中可能会有其他线程依然在分配。
所以为了保证下次GC的顺利进行,需要将这段时间分配的内存空间预留出来。
总结下concurrent_start_bytes_ 的值计算过程:
用heap resize之后计算出的target_size减去remaining_bytes后的数值,得出来的concurrent_start_bytes_ 作为下次是否触发GC的阈值。
Systrace角度看GC
我们平时工作中,分析GC性能问题用到最多的便是Systrace
下面抓取一次抖音包含启动过程的Systrace,看下GC情况以及堆大小的变化情况。
在启动过程中,堆的大小持续增长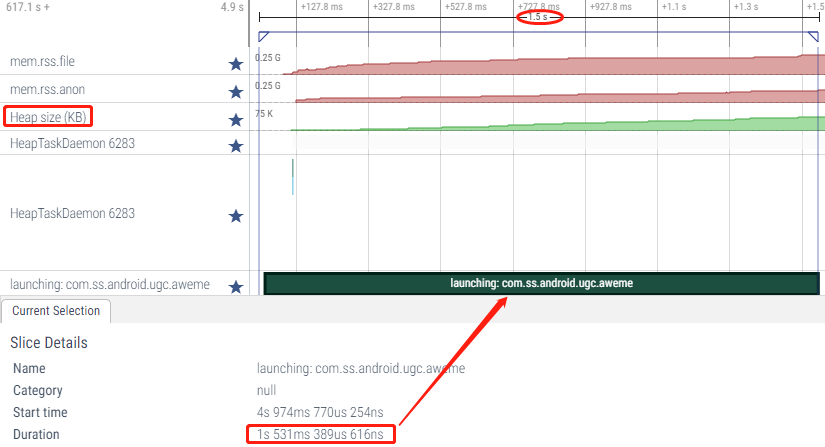
启动结束后约1s左右,有一次Background young concurrent copying GC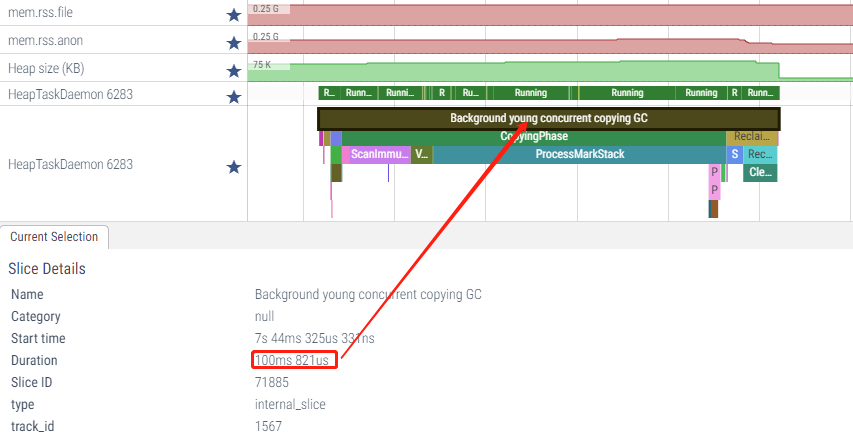
可以看到heap size从59M下降到约11M
此时处于前台很快数值上升,并触发Background concurrent copying GC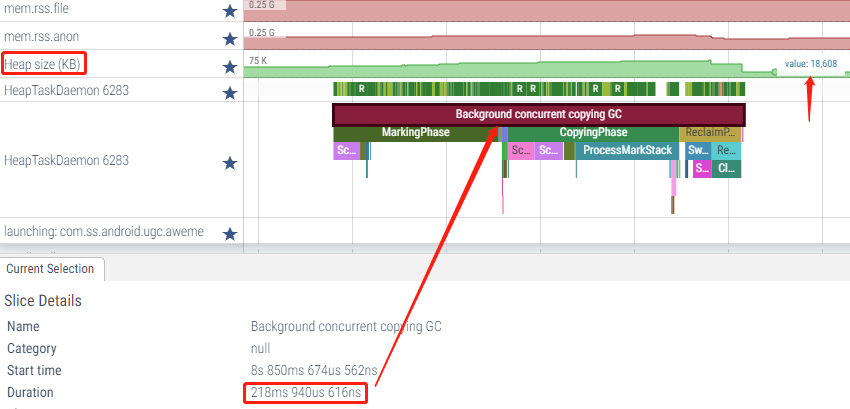
这两次GC类型都是并发GC,以界面显示后的第一次Background young concurrent copying GC为例
从Systrace大致可以看到其流程是1
InitializePhase(995us692ns)->CopyingPhase(84ms258us385ns) ->ReclaimPhase(11ms 166us 769ns)
对应到代码中大致流程如下:1
CollectGarbageInternal---> collector--->Run(开始真正的GC流程)---> RunPhases(GC实际处理)
参数修改策略
通过上面的梳理,我们知道GC的触发以及堆大小的调整会受到max_free_,min_free_,kDefaultTargetUtilization 这些参数影响,这些参数其实有系统属性暴露在外,厂商可以根据实际的需求进行修改。
以max_free为例,看了下手头的4G手机项目上默认值是8M,从前面的梳理我们知道,如果增大max_free会导致应用的预留空闲内存增大,相应的应用占用内存大小也会增大,这是带来的弊端。
但是好处显而易见,GC的频率会降低,性能会有所提升,所以这是一个权衡的策略。
如果项目上实测发现GC频繁触发,可以适当的增大max_free的值再进行测试,谷歌的建议是不要修改,除非有大量可靠的测试数据做支撑说明修改后的参数确实有提升。
下面是我手头4G内存手机打印的参数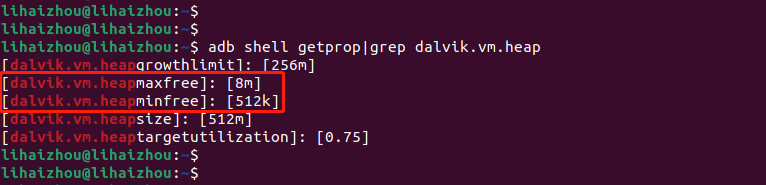
写在最后
至此,本文结合Android S源码和systrace对ART GC的基础知识介绍完毕。
在书写本文期间,阅读了网上一些优秀的资源,如老罗,芦航,oppo内核等人书写的ART技术文章,受益匪浅,在此感谢这些技术大咖的无私分享。
最后说两句,GC对Android整机性能表现起到至关重要的影响,关于ART GC的性能一直是Google在主导优化,同时也是SOC厂商,各家手机厂商长期以来一直努力优化的方向。
我们希望通过对ART GC领域的持续研究,为后面的实际问题分析乃至GC机制的优化修改提供技术支撑。
参考
- ART运行时Foreground GC和Background GC切换过程分
https://www.kancloud.cn/alex_wsc/androids/472237 - Android性能优化(31)—虚拟机调优
https://blog.csdn.net/zhangbijun1230/article/details/79996702 - ART虚拟机 | GC的触发时机和条件
https://juejin.cn/post/6875678394332217357
时间真快,不知不觉今天已经周三了,印象中上次周三的时候还是在上周